What Lighthouse actually measures (and what it doesn't)
Lighthouse is Google's open-source auditing tool. It grades four categories — Performance, Accessibility, Best Practices, SEO — each 0–100. Chrome DevTools runs it, PageSpeed Insights runs it, and countless CI pipelines gate deploys on it.
Before you spend a weekend chasing 100, understand one thing: the Performance score is a lab score. Lighthouse loads your page in a controlled simulation — a mid-tier phone (roughly a Moto G4-class CPU, 4× slowdown) on a throttled 4G-ish connection — and measures what happens. That's a synthetic environment, not your real users. It varies from run to run, and it is not the Core Web Vitals data Google ranks on.
The thing Google actually uses for ranking is field data: real Chrome users' experiences, aggregated in the Chrome User Experience Report (CrUX). That's the "Discover what your real users are experiencing" panel at the top of PageSpeed Insights. Your lab LCP can be 1.4s while your field LCP sits at 3.8s because real users are on worse networks, older devices, and cold caches. So use Lighthouse for what it's good at — finding specific, fixable problems — and judge success against your CrUX/Core Web Vitals field data.
How the Performance score is calculated
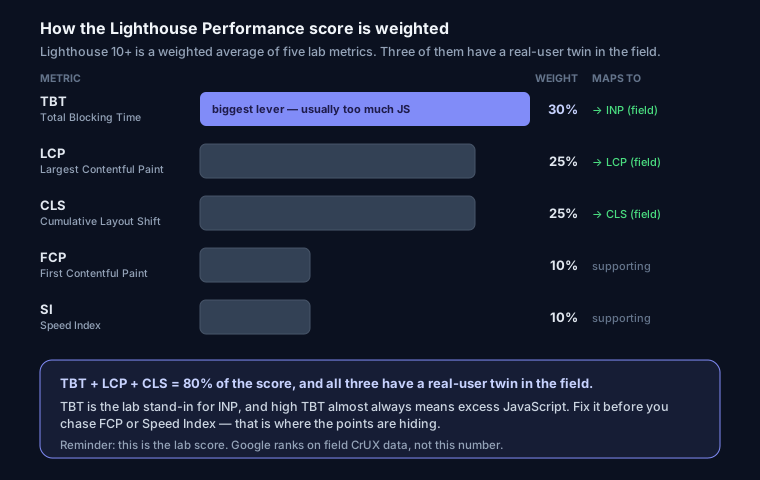
The Performance number isn't a vibe. In Lighthouse 10+ it's a weighted average of five lab metrics:
- Total Blocking Time (TBT) — 30% — the biggest single lever
- Largest Contentful Paint (LCP) — 25%
- Cumulative Layout Shift (CLS) — 25%
- First Contentful Paint (FCP) — 10%
- Speed Index — 10%
TBT is the heavyweight, and it's the lab proxy for INP (Interaction to Next Paint), the responsiveness metric Google added to Core Web Vitals in 2024. TBT measures how long the main thread was blocked by long tasks between FCP and interactive. High TBT almost always means one thing: too much JavaScript. If your score is stuck in the 60s–80s, look at TBT before anything else — it's usually where the points are hiding.
Performance: cut JavaScript first
Most Performance losses trace back to shipping and executing too much JS on the main thread.
Ship less, defer the rest. Any non-critical script should load out of the parser's way:
<!-- Blocks parsing until downloaded + executed — avoid -->
<script src="/analytics.js"></script>

<!-- defer: download in parallel, run after HTML parses, in order -->
<script src="/analytics.js" defer></script>

<!-- async: for independent third-party tags -->
<script src="https://tag.example.com/loader.js" async></script>
In Next.js, push third-party tags to afterInteractive or lazyOnload so they don't compete with hydration:
import Script from 'next/script'

<Script src="https://widget.example.com/w.js" strategy="lazyOnload" />
Serve modern image formats at the right size. Unsized and oversized images inflate LCP and cause layout shift. Always declare dimensions and prefer AVIF/WebP:
<img src="/hero.avif" width="1200" height="630"
     alt="Dashboard showing site audit results"
     fetchpriority="high" decoding="async">
Set fetchpriority="high" on your LCP image and loading="lazy" on below-the-fold ones. Never lazy-load the LCP image — that delays the exact thing the metric measures. More on this in the image SEO guide.
Preconnect to critical origins so the browser opens TLS connections early:
<link rel="preconnect" href="https://fonts.gstatic.com" crossorigin>
<link rel="dns-prefetch" href="https://analytics.example.com">
Turn on compression. Brotli beats gzip by roughly 15–20% on text assets. On nginx:
gzip on;
gzip_types text/css application/javascript image/svg+xml;
brotli on;
brotli_types text/css application/javascript image/svg+xml;
Also kill render-blocking CSS/JS — inline critical CSS, defer the rest. There's a full walkthrough in fix render-blocking resources, and a broader checklist in the website speed optimization guide.
Accessibility: real, but capped
Lighthouse's Accessibility audit is automated, which means it catches the machine-checkable failures and nothing else. Fix these first:
- Color contrast — text must hit WCAG AA (4.5:1 for normal text, 3:1 for large). Light-gray-on-white placeholder text is the usual culprit.
- Labels on every input — a bare
<input>with only a placeholder fails. - Alt text on meaningful images;
alt=""on decorative ones. - Accessible names for icon-only buttons.
<label for="email">Email address</label>
<input id="email" type="email" name="email">

<button aria-label="Close dialog">
  <svg aria-hidden="true"><!-- icon --></svg>
</button>
Be realistic: automated tooling only covers a fraction of WCAG. Lighthouse can confirm a button has a name — it can't tell whether that name makes sense, whether keyboard focus order is logical, or whether a screen reader can actually complete your checkout. A page can score 100 and still be painful to use. Practically, most real apps top out in the high 90s because of intangibles the audit can't judge, and that's fine. Pair it with the web accessibility and SEO checklist and a real keyboard-only pass.
Best Practices: mostly hygiene
This category is a grab-bag of "don't do obviously broken things":
- HTTPS everywhere — no mixed content.
- No errors in the console — Lighthouse logs every uncaught error and dings you.
- Correct image aspect ratio — the rendered size must match the file's intrinsic ratio, or images look squashed.
- No deprecated APIs —
document.write, unload listeners, oldApplication Cache, etc. - A valid Content-Security-Policy is checked for XSS mitigation.
Content-Security-Policy: default-src 'self'; img-src 'self' data:; object-src 'none'
If you're setting CSP and other headers, the security headers guide covers the full set.
SEO: the easy 100
The Lighthouse SEO audit is a shallow technical check — passing it is table stakes, not real SEO. It looks for:
- A non-empty
<title>and a<meta name="description"> - Crawlable
<a href>links (not JS-only click handlers) - A
<meta name="viewport">tag - The page isn't blocked by
robotsorX-Robots-Tag: noindex - Legible font sizes (≥12px for the bulk of text) and adequately sized tap targets
<title>How to Get a Lighthouse Score of 100</title>
<meta name="description" content="Fix TBT, LCP, and CLS to raise your Lighthouse score — with copy-paste code.">
<meta name="viewport" content="width=device-width, initial-scale=1">
Passing all five doesn't mean you'll rank — it means nothing technical is actively blocking you. If Lighthouse flags a missing or truncated title/description, the meta tag generator produces a compliant block in seconds. For what a meaningful score looks like, see what is a good SEO score.
Why your score changes every run
You run Lighthouse twice on the same page and get 91, then 78. Nothing's broken — it's variance, and it's expected. The causes:
- Simulated throttling estimates timings from an unthrottled trace, so small measurement differences swing the result.
- Main-thread contention — other Chrome tabs, extensions, or background CPU on your machine affect a local run.
- Third-party scripts (ads, tag managers, A/B tools) respond at different speeds each load.
- Cold vs warm caches and CDN edge state.
To get a number you can trust: run in an Incognito window with extensions disabled, or better, use PageSpeed Insights (server-side, cleaner environment) or Lighthouse CI, and run at least 3–5 times and take the median. Chasing a single lab number is how people waste days. Anchor on the field CrUX data instead.
FAQ
Is a 100 Performance score necessary to rank? No. Google ranks on field Core Web Vitals thresholds (LCP < 2.5s, INP < 200ms, CLS < 0.1), not your lab score. A 90 with green field data beats a flaky lab 100.
Why is my mobile score so much lower than desktop? Mobile applies CPU and network throttling that desktop doesn't. Mobile is the harder, more realistic test — and it's the one Google's mobile-first index cares about.
Can I really hit 100 on Accessibility? Sometimes, but the automated audit only covers machine-checkable rules. A 100 doesn't guarantee an accessible site; a 96 with clean manual testing is often the honest ceiling.
What's the single fastest way to raise a low score? Reduce JavaScript to cut TBT. It's 30% of the weight and the metric most sites fail hardest.
Go beyond Lighthouse
Lighthouse finds problems but rarely hands you the fix. Run your URL through SEO Snapshot for 100+ checks with copy-paste fix code for every issue — headers, structured data, metadata, and the technical gaps Lighthouse skips entirely.