What Core Web Vitals Actually Are
Core Web Vitals are Google's attempt to put numbers on "does this page feel good to use." They've been a ranking signal since 2021, folded into the broader page experience system. Three metrics, each covering a different failure mode:
- LCP (Largest Contentful Paint) — how long until the biggest thing in the viewport paints. Loading speed.
- INP (Interaction to Next Paint) — how long the page takes to visually respond after a tap, click, or keypress. Responsiveness.
- CLS (Cumulative Layout Shift) — how much stuff jumps around while the page settles. Visual stability.
One correction if you're working from older guides: FID (First Input Delay) was retired in March 2024 and replaced by INP. FID only measured the delay before the browser started processing your first interaction. INP measures the full interaction — input delay, processing time, and the paint that follows — across every interaction on the page, reporting a value near the worst one. It's much harder to game, and plenty of sites that passed FID comfortably fail INP.
The Thresholds (and the 75th-percentile Trap)
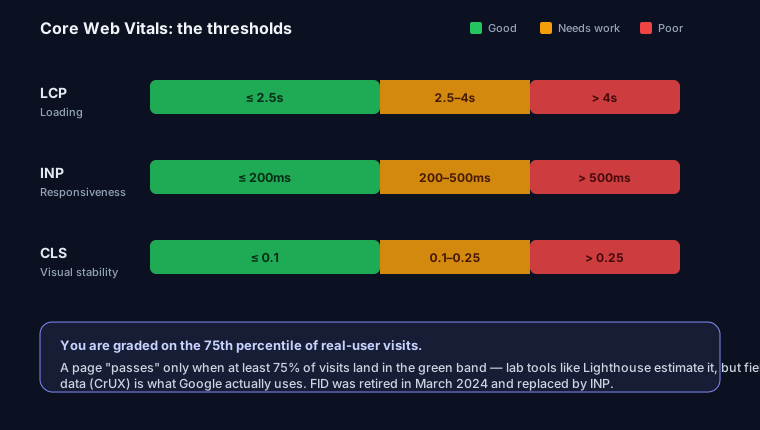
Here's where each metric sits:
| Metric | Good | Needs improvement | Poor |
|---|---|---|---|
| LCP | ≤ 2.5 s | 2.5 s – 4 s | > 4 s |
| INP | ≤ 200 ms | 200 ms – 500 ms | > 500 ms |
| CLS | ≤ 0.1 | 0.1 – 0.25 | > 0.25 |
The number that trips people up: Google grades you at the 75th percentile of your real field traffic, not a single lab run. So if 74% of your visitors get a fast LCP but the slowest quarter sits at 3.1 seconds, your reported LCP is 3.1 seconds — "needs improvement," even though most people had a good experience. You're being scored on your slow tail, which usually means mobile users on mid-tier phones and flaky connections.
That's also why lab and field data disagree constantly:
- Lab data (Lighthouse, the PageSpeed Insights "diagnostics" tab) is a single simulated run on one throttled device. Reproducible and great for debugging, but it can't measure INP at all — there's no real user clicking. Lighthouse substitutes Total Blocking Time (TBT) as a proxy.
- Field data (the Chrome UX Report / CrUX, surfaced in Search Console and the top of any PageSpeed result) is aggregated from real Chrome users over a rolling 28 days. This is what affects rankings.
Chase the field numbers. Use lab tools to find why a field number is bad, then confirm the fix showed up in CrUX weeks later. The SEO Snapshot analyzer pulls both side by side — so run your URL and read the field column first.
Fixing LCP
The LCP element is almost always a hero image, a big heading, or a background image. Step one is to identify it — Lighthouse tells you which element it picked, or you can check the "Largest Contentful Paint element" line in the PSI diagnostics. Once you know the element, everything else is about getting bytes to it faster.
Prioritize the LCP resource. Add fetchpriority="high" so the browser fetches it ahead of other images, and never lazy-load it — loading="lazy" on your hero image is one of the most common self-inflicted LCP wounds.
<img src="/hero.webp" width="1200" height="630"
     fetchpriority="high" alt="…">
If the image is referenced from CSS (a background-image) or loaded late by JavaScript, the browser discovers it too late. Preload it:
<link rel="preload" as="image" href="/hero.webp" fetchpriority="high">
Fix TTFB. A slow server pushes back everything downstream. Put a CDN in front (Cloudflare's free tier, or Vercel's edge network on Next.js), cache HTML where you can, and turn on Brotli or gzip. A TTFB over ~600 ms means you're burning your whole LCP budget before a single pixel paints.
Kill render-blocking resources. Every blocking stylesheet and synchronous script in <head> delays the paint. Inline critical CSS, defer the rest, and load non-critical JS with defer or type="module". This is worth its own deep-dive — see how to fix render-blocking CSS and JS, plus the broader website speed optimization guide for the full pipeline. And since the LCP element is usually an image, image SEO done right (WebP/AVIF, correct sizing, no lazy-loading above the fold) does double duty here.
Fixing INP
INP is a JavaScript problem 90% of the time. When a user clicks, the main thread has to be free to respond — if it's busy running a 300 ms analytics callback or hydrating a component, the interaction just sits there.
Break up long tasks. Anything over 50 ms on the main thread blocks input. Split heavy work and yield between chunks:
async function processItems(items) {
  for (const item of items) {
    doWork(item);
    // hand control back so the browser can paint / respond
    await scheduler.yield?.() ??
      new Promise(r => setTimeout(r, 0));
  }
}
Reduce and defer JavaScript. Code-split with dynamic import(), ship less to begin with, and move pure computation into a Web Worker so it never touches the main thread. Debounce expensive handlers — a search box that fires on every keystroke should wait until typing pauses. And audit your event handlers: a scroll or input listener doing layout-thrashing DOM reads will tank INP.
Use content-visibility for long pages. It tells the browser to skip rendering work for offscreen sections until they're needed, cutting the main-thread cost of the initial render:
.below-the-fold {
  content-visibility: auto;
  contain-intrinsic-size: 0 800px; /* reserve height to avoid CLS */
}
Fixing CLS
CLS is the most fixable metric — it's almost entirely about reserving space before content arrives.
Always set dimensions on media. Width and height (or a CSS aspect-ratio) let the browser reserve the box before the image loads, so nothing reflows when it does:
img, video { aspect-ratio: attr(width) / attr(height); height: auto; }
Reserve space for ads, embeds, and iframes. Give every ad slot and third-party embed a fixed min-height matching its most common size. An ad that loads in and shoves your article down is a classic layout-shift.
Tame web fonts. A font swapping in at a different size nudges everything around it. Use font-display: optional (no swap, no shift — the fallback just stays if the font is slow) or swap paired with a size-matched fallback via size-adjust:
@font-face {
  font-family: 'Inter';
  font-display: optional;
  src: url('/inter.woff2') format('woff2');
}
Never insert content above the fold after load. Cookie banners, promo bars, and "you might also like" strips injected at the top push everything down. If you must show them, overlay them or reserve their space in advance.
FAQ
Do I need to pass all three metrics to get the ranking benefit? Yes — a URL is only "good" in Google's page experience assessment when LCP, INP, and CLS are all in the good range at the 75th percentile. One poor metric fails the whole URL group.
Why does PageSpeed Insights show green but Search Console says I'm failing? Because they measure different things. PSI's headline score is often lab (Lighthouse) data from one run; Search Console reports field (CrUX) data from real users over 28 days. Trust the field data for rankings.
My site is fast on my laptop — why is INP bad? Your dev machine isn't representative. INP is dominated by the slow quarter of real users on mid-range Android phones. Throttle your CPU 4–6x in DevTools and test on a real budget device.
How long until fixes show up in Search Console? CrUX is a rolling 28-day window, so expect a few weeks before a deployed fix fully moves your reported numbers. Confirm the change in lab tools right away, then watch the field data catch up.